

Did you know that nearly 80% of investors make decisions without fully understanding financial statements? This knowledge gap costs Americans billions in lost returns annually. In today’s complex market landscape, deciphering stock quotes and financial documents isn’t just helpful—it’s essential for investment success.
When you see FedEx (NYSE:FDX) trading at 10.4x forward P/E or Stanley Black & Decker (NYSE:SWK) at 13.2x, these numbers tell a critical story about company valuation. Yet many investors struggle to translate these figures into actionable insights that could protect and grow their portfolios.
This guide breaks down the essential components of stock quotes and introduces you to financial statement fundamentals. We’ll transform seemingly complex metrics into practical tools you can apply immediately. Just as innovative AI stocks demonstrate remarkable growth through their financial indicators, you’ll learn to spot similar opportunities in your investment journey.
Whether you’re building your first portfolio or refining your analysis techniques, mastering these basics creates a foundation for more confident, informed investing decisions. Let’s demystify the numbers that drive Wall Street and empower your financial future.
Key Takeaways
- Nearly 80% of investors make decisions without properly understanding financial statements
- Stock quotes contain critical valuation metrics like P/E ratios that reveal company health
- Financial statements provide standardized insights into a company’s operational performance
- Understanding these basics helps investors avoid common pitfalls and identify opportunities
- Real-world examples like FedEx (10.4x P/E) demonstrate how these metrics apply to investment decisions
- Mastering financial document analysis is a foundational skill for successful long-term investing
Understanding Stock Quotes: The Basics
The lexicon of stock quotes, initially perplexing, is indispensable for any investor. These financial indicators serve as the pulse of the market, delivering real-time data on a company’s shares, extending beyond mere current price. This data is fundamental for interpreting financial statements and guiding investment choices.
A stock quote encapsulates a security’s current trading details. These standardized datasets offer investors critical insights, laying the groundwork for interpreting financial statements and informed investment decisions.
Upon examining a stock quote, several key pieces of information emerge. The ticker symbol, such as NASDAQ:PESI, NYSE:FDX (FedEx), or NYSE:SWK (Stanley Black & Decker), identifies the company. This is followed by the current trading price and the price change, presented in both dollar and percentage formats.
Volume indicators reveal the number of shares traded during the session. High volume signifies significant investor interest, validating price movements. In contrast, low volume may indicate a lack of conviction in the price change.
Quotes also display the day’s trading range, highlighting the highest and lowest prices. This range aids in understanding the stock’s volatility and identifying support or resistance levels.
| Component | Example | What It Tells You | Why It Matters |
|---|---|---|---|
| Ticker Symbol | NASDAQ:PESI | Company identity and exchange | Helps locate the correct company |
| Current Price | $157.42 | Latest trading value | Current market valuation |
| Price Change | +$2.31 (+1.49%) | Daily movement | Indicates performance trend |
| Volume | 3.2M shares | Trading activity level | Shows investor interest |
| 52-Week Range | $112.30 – $169.75 | Annual price boundaries | Provides historical context |
The evolution of stock quotes mirrors the technological progress of financial markets. From the late 1800s’ ticker tape machines to today’s digital displays and mobile apps, the delivery of information has evolved dramatically.
Nowadays, stock quotes are accessible on financial news websites like Bloomberg, CNBC, or Yahoo Finance. Brokerage platforms also offer detailed quote information, often accompanied by analytical tools to aid in interpreting financial statements and market data analysis.
It’s noteworthy that stock quotes can vary across different exchanges. The primary U.S. exchanges—NYSE, NASDAQ, and AMEX—may exhibit minor price discrepancies for the same security, influenced by differences in order execution and timing.
Quote timing also affects the information available. During market hours (typically 9:30 AM to 4:00 PM Eastern Time), quotes are either real-time or slightly delayed, depending on the service. Post-market quotes reflect extended trading sessions but often feature wider spreads and lower volumes.
Understanding the bid-ask spread—the difference between buyer and seller offers—provides insight into a stock’s liquidity. Narrow spreads indicate high liquidity, while wider spreads suggest lower trading volume and potentially higher transaction costs.
Market depth information, available on many trading platforms, reveals pending buy and sell orders at various price levels. This data aids in gauging support or resistance levels and is invaluable when interpreting financial statements in the context of market sentiment.
By grasping the fundamentals of stock quotes, you lay a critical foundation for advanced financial analysis. This knowledge bridges the gap between raw market data and the deeper insights gained from thorough financial statement analysis, which we will explore in subsequent sections.
The Importance of Financial Statements
At the core of every successful investment strategy lies a profound comprehension of financial statements. These documents serve as the most dependable source of standardized information regarding an entity’s financial health, operational efficiency, and growth trajectory. For investors aiming to accumulate wealth through informed decisions, proficiency in financial statement analysis is not merely advisable—it is imperative.
Consider Calibre Mining Corp’s recent sustainability report, which showcased impressive financial performance metrics: US$586 million in revenue and a 60% increase in share price. These figures, derived directly from their financial statements, illustrate how these documents translate complex business activities into quantifiable outcomes that investors can scrutinize.
Financial statements provide a universal language for assessing business performance. They transform myriad transactions and economic events into structured reports that adhere to consistent rules and formats. This standardization empowers investors to compare companies across diverse industries, sizes, and geographic locations with confidence.
The significance of these documents transcends individual investors. Multiple stakeholders rely on financial statement analysis to make critical decisions:
- Investors evaluate profitability trends and growth prospects
- Creditors assess debt repayment capacity and financial stability
- Management teams measure operational efficiency and strategic success
- Regulators ensure compliance with reporting standards
- Analysts develop forecasts and investment recommendations
The importance of financial statements is underscored by stringent regulatory requirements. Public companies must prepare these documents according to Generally Accepted Accounting Principles (GAAP) or International Financial Reporting Standards (IFRS). These frameworks ensure consistency, comparability, and transparency—qualities that safeguard investors and uphold market integrity.
When executed correctly, financial statement analysis uncovers patterns and relationships that might remain concealed. By examining how figures interconnect across different statements, investors can develop a holistic understanding of a company’s financial standing, transcending isolated metrics.
Financial statements are akin to an X-ray into a company’s economic reality. They unveil both the evident strengths and the concealed weaknesses that dictate long-term investment success.
The true potency of financial statements emerges when investors grasp how different stakeholders utilize them for various purposes. This multi-faceted approach enriches analysis and offers a more complete vista of a company’s prospects.
| Stakeholder | Primary Focus | Key Metrics Analyzed | Decision Outcome |
|---|---|---|---|
| Investors | Profitability & Growth | EPS, ROE, Revenue Growth | Buy, Sell, or Hold Decisions |
| Creditors | Solvency & Liquidity | Debt Ratios, Interest Coverage | Lending Terms & Amounts |
| Management | Operational Efficiency | Profit Margins, Asset Turnover | Strategic Planning & Resource Allocation |
| Analysts | Valuation & Forecasting | P/E Ratio, Discounted Cash Flow | Price Targets & Recommendations |
By mastering financial statement analysis, investors gain the capability to identify red flags before they escalate into crises. Unusual inventory buildups, declining cash flows despite profit growth, or increasing days sales outstanding can signal problems that might not be immediately apparent to casual observers.
Conversely, this analytical skill enables the identification of growth opportunities that others might overlook. Companies reinvesting heavily in research and development, expanding into new markets, or improving operational efficiency often exhibit patterns in their financial statements that foretell future success.
The ultimate value of financial statements resides in their capacity to transform investment decisions from speculative conjectures into data-driven conclusions. When we analyze these documents effectively, we transcend market rumors and emotional reactions to construct investment strategies grounded in solid financial evidence.
As we continue to explore this subject, we will dissect the three main financial statements in detail, demonstrating how each contributes unique insights to your overall comprehension of a company’s financial health and prospects.
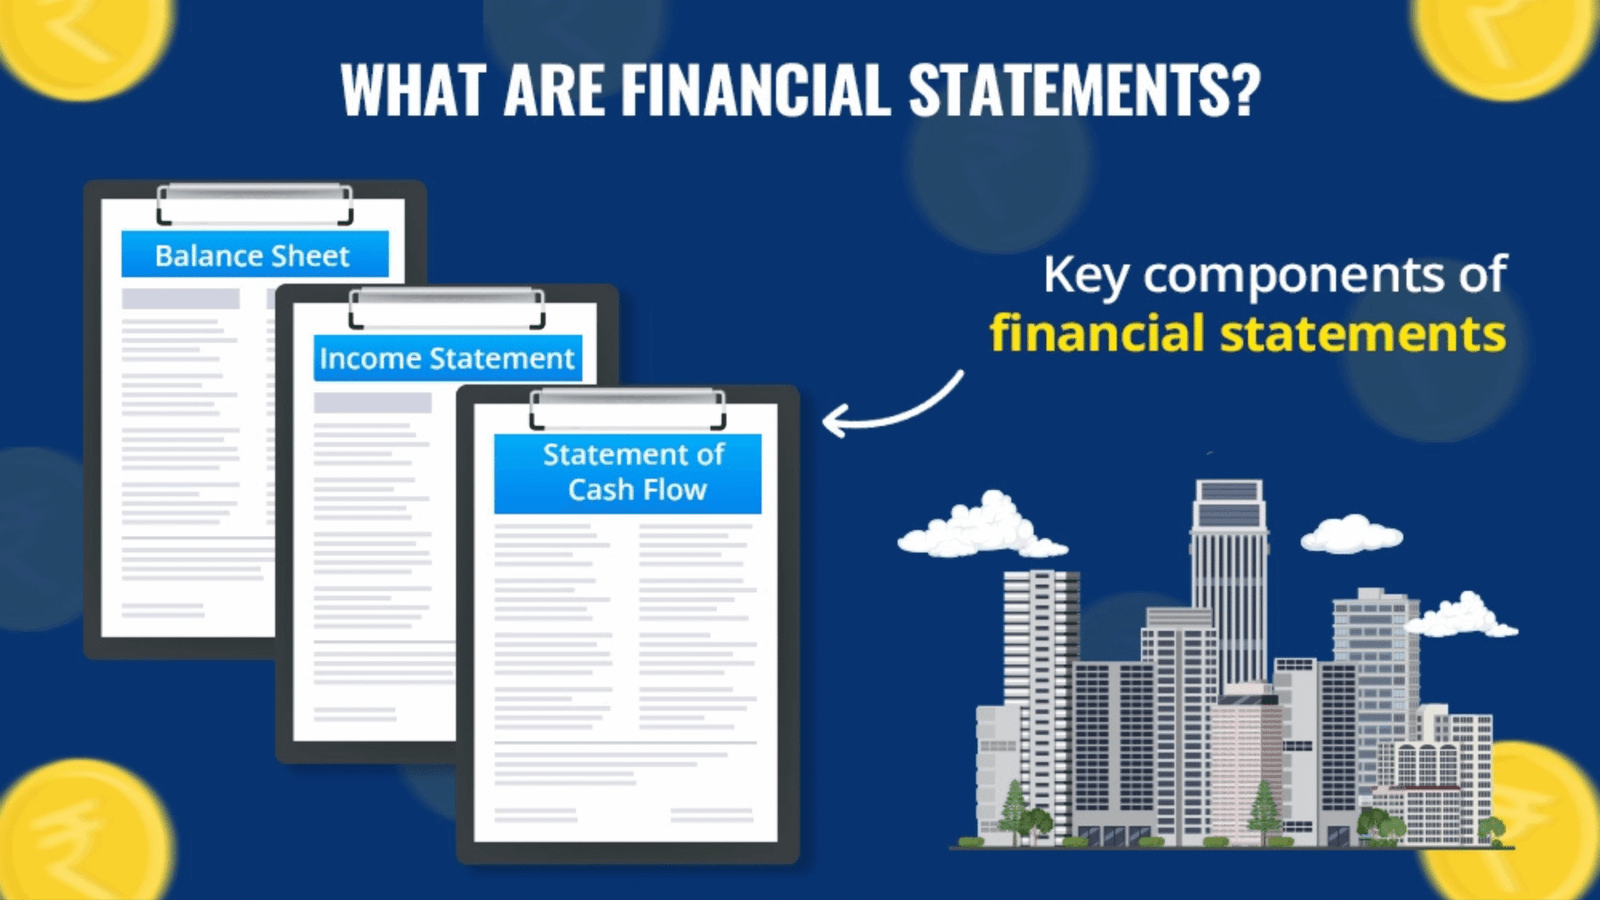
The Three Main Financial Statements

The trio of financial statements—income statement, balance sheet, and cash flow statement—constitutes the bedrock of any exhaustive investment analysis. These documents collectively offer a holistic perspective on a company’s financial health, each providing distinct insights that complement one another. Mastery in deciphering these statements is imperative for making well-informed investment choices.
Consider these statements as various lenses through which to scrutinize a company’s performance. No single statement encapsulates the entire narrative—it is their collective analysis that unveils the company’s true financial state.
The Income Statement
The income statement (also known as the profit and loss statement) chronicles a company’s revenues and expenses over a defined period, typically a quarter or fiscal year. This document addresses a fundamental query: does the company yield profits?
The income statement commences with revenue (the aggregate income from sales) and then deducts various costs and expenses to culminate in the net income. Key components include:
- Gross revenue (total sales)
- Cost of goods sold (direct costs of producing products)
- Operating expenses (salaries, rent, marketing)
- Interest expenses and taxes
- Net income (the final profit or loss)
This statement aids investors in assessing a company’s operational efficiency and pricing prowess. An uptick in revenues accompanied by stable or enhanced profit margins generally signifies a robust business with competitive advantages.
The Balance Sheet
The balance sheet offers a snapshot of a company’s assets versus liabilities at a particular juncture. It adheres to a straightforward equation: Assets = Liabilities + Shareholders’ Equity.
Assets encompass everything the company possesses of value—cash, inventory, property, equipment, and investments. Liabilities represent all debts and obligations the company must settle with others, encompassing short-term accounts payable to long-term loans.
The disparity between assets and liabilities constitutes shareholders’ equity—essentially, what would remain for shareholders if all assets were liquidated and all debts were settled. This statement facilitates investors in evaluating:
- Financial stability and solvency
- Debt levels and leverage
- Asset utilization efficiency
- Capital structure
The Cash Flow Statement
The cash flow statement tracks the actual flow of money into and out of the business. While the income statement might depict a profit, a company can encounter cash shortages if that profit is not collected in cash or is tied up in inventory or equipment purchases.
This statement categorizes cash movements into three segments:
- Operating activities: Cash generated from core business operations
- Investing activities: Cash used for long-term assets or investments
- Financing activities: Cash from loans, stock issuances, or dividend payments
The cash flow statement discloses whether a company generates sufficient cash to fund operations and growth—a critical factor that the income statement alone cannot convey. A company might report profits but face bankruptcy if it cannot convert those profits into cash.
How These Statements Work Together
When analyzed in tandem, these three statements unveil profound insights. For instance, if a company exhibits increasing profits on the income statement but declining cash flow from operations, this could signal accounting irregularities or difficulties in collecting from customers.
Conversely, a balance sheet showing rapidly escalating debt alongside an income statement with stagnant revenues might indicate unsustainable growth strategies. We often seek consistency across these statements as a marker of financial health.
Discrepancies between statements can unveil critical insights about accounting quality and business sustainability. For example, consistently lower cash flows than reported income might indicate aggressive revenue recognition practices or other accounting concerns.
By grasping the interconnection between these three financial statements, investors establish a robust foundation for evaluating investment prospects and identifying red flags before they escalate into serious issues.
Breaking Down the Income Statement
The deciphering of an income statement unveils investors to a company’s prowess in profit generation from its operational activities. This critical financial document delineates the correlation between revenues garnered and expenses incurred over a specific interval, commonly a quarter or fiscal year.
The income statement’s structure, logical and sequential, narrates a company’s financial narrative. Each component, when examined, offers a holistic comprehension of this indispensable financial statement.
Revenue: The Starting Point
Revenue, often termed the “top line,” occupies the pinnacle of the income statement. It encapsulates the aggregate income derived from a company’s core business activities, prior to any cost deductions.
The composition of revenue is of significant import in financial statement analysis. A company with a diversified revenue base typically exhibits greater stability than one reliant on a single product or service. For instance, a technology entity generating income from hardware, software, and services may better withstand market fluctuations than one dependent solely on hardware sales.
Understanding Expenses
Below revenue, the income statement elucidates various expense categories, revealing a company’s operational efficiency. The primary expense categories include:
- Cost of Goods Sold (COGS): Direct costs associated with producing goods or services sold
- Operating Expenses: Costs related to running the business (salaries, rent, marketing)
- Depreciation and Amortization: Allocation of asset costs over their useful lives
- Interest Expenses: Costs of borrowing money
- Tax Expenses: Payments to government authorities
The interplay between these expenses and revenue offers invaluable insights into a company’s operational efficiency and cost management prowess. A company that maintains stable or decreasing expense ratios while increasing revenue demonstrates robust operational discipline.
Net Income: The Bottom Line
Net income, the “bottom line,” is derived by subtracting all expenses from revenue. This figure represents the company’s ultimate profitability during the reporting period. Net income serves as a critical indicator of financial health and management effectiveness.
Yet, examining net income in isolation can be misleading. A growing company might exhibit lower net income due to investments in future growth. On the other hand, a company might artificially inflate short-term profits by curtailing essential investments such as research and development.
“The income statement is akin to a movie of a company’s performance over time, whereas the balance sheet is akin to a snapshot at a specific moment. Both are indispensable, yet the income statement discloses a company’s ability to generate profit—the ultimate objective of any enterprise.”
Critical Margin Metrics
Margins represent the percentage of revenue that translates into different profit levels. These metrics facilitate meaningful comparisons across companies of varying sizes, serving as essential tools in income statement analysis.
| Margin Type | Calculation | What It Reveals | Ideal Trend |
|---|---|---|---|
| Gross Margin | (Revenue – COGS) / Revenue | Efficiency in production and pricing power | Stable or increasing |
| Operating Margin | Operating Income / Revenue | Operational efficiency excluding financing decisions | Stable or increasing |
| Net Profit Margin | Net Income / Revenue | Overall profitability after all expenses | Stable or increasing |
| EBITDA Margin | EBITDA / Revenue | Operational performance before accounting decisions | Stable or increasing |
Earnings Per Share (EPS)
Earnings per share represents the portion of a company’s profit allocated to each outstanding share of common stock. Calculated by dividing net income by the number of outstanding shares, EPS forms the basis for the widely-used price-to-earnings (P/E) ratio.
The significance of EPS is evident in real-world scenarios. For instance, FedEx’s earnings per share grew by only 2% annually over a two-year period, lagging behind its peers. This metric immediately signals concerns regarding the company’s profitability relative to its industry.
Red Flags in Income Statement Analysis
Effective financial statement analysis necessitates the identification of warning signs in the income statement. Be vigilant for these red flags:
- Consistently declining margins despite stable or growing revenue
- Revenue growth that doesn’t translate to profit growth
- Frequent “non-recurring” expenses that appear regularly
- Significant discrepancies between reported earnings and cash flow
- Unusual changes in accounting methods that boost reported profits
Non-recurring items and discontinued operations require particular attention. Companies sometimes classify regular expenses as “one-time” to enhance their ongoing operations’ appearance of profitability. Always scrutinize the footnotes to comprehend these classifications.
By mastering income statement analysis, investors acquire the capability to evaluate a company’s operational performance and earnings quality. This knowledge is fundamental for making informed investment decisions, grounded in a company’s fundamental financial health, as opposed to market hype or short-term price movements.
Analyzing the Balance Sheet
The balance sheet, a cornerstone of financial reporting, offers a snapshot of a company’s financial health at a specific point in time. It delineates assets, liabilities, and equity, providing a snapshot distinct from income statements, which chronicle performance over time. This statement is governed by a fundamental accounting equation: Assets = Liabilities + Shareholders’ Equity. This equation ensures that the financial position is accurately reflected, balancing assets against liabilities and equity.
Grasping this equation is critical for investors aiming to assess a company’s financial stability. Liberty Broadband’s recent disclosure of an “unfavorable liquidity position” prompted analysts to scrutinize the balance sheet for deeper insights into the company’s financial structure.
Breaking Down Assets
Assets, representing resources owned by a company, are expected to yield future economic benefits. They are categorized into current and long-term assets.
Current assets, expected to be converted into cash within a year, include cash, marketable securities, accounts receivable, inventory, and prepaid expenses. The liquidity of these assets is a critical factor, with cash being the most liquid and inventory the least.
Long-term assets, providing value over multiple years, encompass property, plant, and equipment (PP&E), intangible assets such as patents and trademarks, and long-term investments. These assets signify significant capital investments, supporting operational capacity and competitive advantages.
Understanding Liabilities
Liabilities, representing obligations a company must fulfill, are categorized by timeframe. Current liabilities, due within one year, include accounts payable, short-term debt, accrued expenses, and the current portion of long-term debt.
Long-term liabilities, extending beyond one year, comprise bonds payable, long-term loans, lease obligations, and pension liabilities. The structure of liabilities reveals a company’s financial risk profile and its ability to navigate economic downturns.
Shareholders’ Equity Explained
Shareholders’ equity represents the residual interest in assets after deducting liabilities, reflecting what remains for shareholders if all assets were liquidated and all debts paid. It encompasses common and preferred stock, additional paid-in capital, retained earnings, and treasury stock.
A growing shareholders’ equity generally signifies a financially robust company, capable of generating and retaining profits over time.
Key Balance Sheet Metrics
Several critical metrics aid investors in evaluating a company’s financial position:
Working Capital (Current Assets – Current Liabilities) measures operational efficiency and short-term financial health. Positive working capital indicates the company’s ability to cover short-term obligations.
Debt-to-Equity Ratio (Total Debt ÷ Shareholders’ Equity) reveals the extent to which a company finances operations through debt versus shareholder investments. Higher ratios indicate greater financial risk.
Asset Turnover Ratio (Revenue ÷ Average Total Assets) demonstrates how efficiently a company uses its assets to generate revenue. Higher ratios signify more efficient operations.
Identifying Red Flags
Effective balance sheet analysis involves identifying concerns before they escalate. Watch for these warning signs:
| Red Flag | What It Indicates | Why It Matters |
|---|---|---|
| Declining Cash Balances | Potential liquidity issues | May signal inability to meet short-term obligations |
| Rising Debt Levels | Increasing financial leverage | Higher interest expenses and financial risk |
| Ballooning Inventory | Possible sales slowdown | Cash tied up in unsold products |
| Growing Accounts Receivable | Collection difficulties | Revenue recognized but cash not received |
| Goodwill Impairments | Overvalued acquisitions | Previous investments worth less than paid |
The balance sheet offers critical insights into a company’s financial stability, liquidity position, and capital structure. By understanding how to interpret this statement effectively, investors can identify companies with strong financial foundations capable of weathering economic challenges and generating sustainable returns.
When analyzing balance sheets, comparing figures across multiple periods to identify trends is essential. A single balance sheet provides a snapshot, but comparing several consecutive statements reveals the direction of a company’s financial health. This longitudinal perspective often proves more valuable than isolated data points.
Mastering the Cash Flow Statement

The cash flow statement, a cornerstone of financial reporting, serves as a definitive indicator of a company’s financial health. Unlike the income statement and balance sheet, which rely on accrual accounting, the cash flow statement provides a direct view of cash inflows and outflows. This makes it a less susceptible target for manipulation, rendering it a critical tool for financial analysis.
Consider the cash flow statement as a financial truth detector. It uncovers whether a company is generating cash or depleting its reserves. This distinction is vital, as a company can report profits without possessing the liquidity to meet its financial obligations.
The cash flow statement is segmented into three sections, each shedding light on different facets of a company’s financial activities:
| Cash Flow Section | What It Shows | Why It Matters | Warning Signs |
|---|---|---|---|
| Operating Activities | Cash generated from core business operations | Reveals if the primary business model is self-sustaining | Consistently negative operating cash flows |
| Investing Activities | Capital expenditures, acquisitions, asset sales | Shows how the company is investing in future growth | Selling core assets to fund operations |
| Financing Activities | Transactions with lenders and shareholders | Indicates debt management and shareholder returns | Heavy reliance on external financing |
Operating Cash Flows: The Business Engine
Operating cash flows reflect the financial health of a company’s core activities. This section commences with net income, adjusting for non-cash items and changes in working capital. Strong, consistent operating cash flows signify a financially robust business capable of sustaining itself without external funding.
Analyze operating cash flows to discern the relationship between net income and operating cash flow. A persistent gap between these figures necessitates further investigation. If net income consistently exceeds operating cash flow, it may indicate the use of aggressive accounting practices to inflate earnings.
Cash is a fact, profit is an opinion. The cash flow statement doesn’t lie about a company’s true financial condition.
Investing Cash Flows: Building for Tomorrow
The investing section elucidates a company’s capital deployment for long-term growth. Capital expenditures (CapEx) represent investments in physical assets, while acquisitions reflect growth through business purchases. Asset sales might indicate restructuring or cash generation.
Healthy companies typically exhibit negative investing cash flows, indicating investment in growth. If a company is selling core assets to fund operations, it may signal financial distress.
Financing Cash Flows: Dealing with Capital Providers
Financing activities encompass transactions with lenders and shareholders. This section reveals a company’s capital management and shareholder returns.
A company consistently issuing new debt or equity to fund operations may face sustainability challenges. Share repurchases and dividend payments typically signal financial strength, provided they are funded by operating cash flows, not debt.
Free Cash Flow: What Really Matters
Free cash flow (FCF), derived from the cash flow statement, is a critical metric. It represents cash available for shareholder value enhancement through dividend payments, share repurchases, debt reduction, and strategic acquisitions.
- Dividend payments
- Share repurchases
- Debt reduction
- Strategic acquisitions
Real-world examples underscore the significance of monitoring cash flow trends. Stanley Black & Decker’s free cash flow margin declined by 8.7 percentage points over five years, while Liberty Broadband’s margin dropped by 34.1 percentage points. These declines served as early warning signs of financial challenges, even when other metrics appeared favorable.
The Cash Flow Paradox
One of the most insightful aspects of cash flow analysis is understanding why profitable companies can face cash shortages. This paradox often arises from rapid growth, long collection cycles, major capital expenditures, and accounting treatments that recognize revenue before cash is collected.
Conversely, companies reporting accounting losses might maintain strong cash positions through non-cash expenses like depreciation, amortization, or one-time write-downs that do not affect current cash flows.
When conducting financial statement analysis, always reconcile the cash flow statement with the income statement and balance sheet. Significant discrepancies often reveal the most important insights about a company’s true financial condition.
By mastering the cash flow statement, one gains the ability to see beyond accounting profits to understand a company’s actual financial flexibility, operational efficiency, and long-term sustainability. In many ways, this makes the cash flow statement the most revealing of the three main financial documents.
Key Financial Ratios to Know
Financial ratios, derived from financial statements, are critical metrics that unveil deeper insights into a company’s operational efficiency and financial stability. These ratios transform raw financial data into meaningful comparisons, applicable across companies of varying sizes and industries. Let’s explore the most important financial ratios that every investor should understand.
Liquidity Ratios: Measuring Short-Term Financial Health
Liquidity ratios assess a company’s ability to meet its short-term obligations. These metrics are essential for determining if a business can pay its bills without raising external capital.
The current ratio divides current assets by current liabilities. A ratio above 1.0 indicates the company has more short-term assets than liabilities—generally a good sign. An extremely high current ratio might suggest inefficient use of assets.
The quick ratio (or acid-test ratio) is more stringent, excluding inventory from current assets before dividing by current liabilities. This provides a clearer picture of immediate liquidity, as inventory can’t always be quickly converted to cash.
Profitability Ratios: Evaluating Earnings Power
Profitability ratios measure how efficiently a company generates earnings. These metrics help investors understand the company’s ability to convert revenue into actual profit.
Gross margin (gross profit divided by revenue) reveals how much money remains after accounting for the cost of goods sold. A higher gross margin indicates stronger pricing power or production efficiency.
Operating margin takes into account operating expenses, showing how much profit a company makes from its core business operations. Net profit margin factors in all expenses, including taxes and interest, providing the bottom-line percentage.
Return on Assets (ROA) and Return on Equity (ROE) measure how effectively a company uses its resources to generate profit. ROA divides net income by total assets, while ROE divides net income by shareholders’ equity. Higher percentages indicate more efficient use of assets or shareholder investments.
Leverage Ratios: Assessing Financial Risk
Leverage ratios evaluate a company’s debt levels and ability to meet financial obligations. These metrics help investors gauge financial risk and flexibility.
The debt-to-equity ratio compares total debt to shareholders’ equity. A higher ratio suggests more aggressive financing with debt, which can amplify both gains and losses.
The interest coverage ratio divides operating income by interest expenses, showing how easily a company can pay the interest on its outstanding debt. A ratio below 1.5 often signals financial distress.
The debt-to-EBITDA ratio measures how many years it would take to pay off debt using earnings before interest, taxes, depreciation, and amortization. Lenders frequently use this metric when evaluating creditworthiness.
Valuation Ratios: Determining Investment Value
Valuation ratios help investors determine whether a stock is potentially undervalued or overvalued relative to its fundamentals or peers.
The price-to-earnings (P/E) ratio compares a company’s stock price to its earnings per share. A lower P/E might indicate an undervalued stock, while a higher P/E could suggest investors expect strong future growth.
The price-to-sales (P/S) ratio divides market capitalization by annual revenue. This metric is useful for evaluating companies that aren’t yet profitable.
The enterprise value-to-EBITDA (EV/EBITDA) ratio offers a more complete valuation measure by considering debt and cash positions alongside market capitalization.
Efficiency Ratios: Measuring Operational Performance
Efficiency ratios reveal how effectively a company manages its resources and operations. These metrics highlight operational strengths or weaknesses.
Inventory turnover shows how many times a company sells and replaces its inventory during a period. Higher turnover typically indicates efficient inventory management.
Accounts receivable turnover measures how quickly a company collects payment from customers. A higher ratio suggests more effective collection practices.
Asset turnover divides revenue by average total assets, indicating how efficiently a company uses its assets to generate sales.
| Ratio Category | Key Metrics | What It Tells You | Ideal Range |
|---|---|---|---|
| Liquidity | Current Ratio, Quick Ratio | Short-term debt-paying ability | 1.5-3.0 (Current), 1.0-1.5 (Quick) |
| Profitability | Gross Margin, ROE, ROA | Earnings power and efficiency | Industry-dependent, higher is better |
| Leverage | Debt-to-Equity, Interest Coverage | Financial risk and flexibility | 0.3-0.6 (D/E), >3.0 (Interest Coverage) |
| Valuation | P/E, EV/EBITDA, P/S | Relative investment value | Industry-dependent, lower often better |
| Efficiency | Inventory Turnover, Asset Turnover | Operational effectiveness | Industry-dependent, higher is better |
By mastering these key financial ratios, investors develop a more nuanced understanding of a company’s operational efficiency, financial health, and relative valuation. These skills are essential for identifying promising investment opportunities and avoiding pitfalls in the market.
Remember that no single ratio tells the complete story. The most effective financial statement analysis combines multiple ratios and examines trends over time, providing a complete picture of a company’s performance and prospects.
Practical Tips for Reading Financial Statements
To extract meaningful insights from financial statements, investors must employ practical techniques that unveil the narrative behind the figures. Interpreting financial statements effectively necessitates delving beyond superficial numbers to discern their true implications for a company’s well-being.
When scrutinizing income statements, focus on three critical areas: revenue growth trends, margin stability, and unusual expense fluctuations. Inquire: Is revenue growth organic or acquisition-driven? Are profit margins expanding, stable, or contracting? Sudden changes in specific expense categories often signal underlying issues worth investigating.
For balance sheets, initiate by assessing liquidity through working capital trends. Compare debt levels to industry standards to determine if borrowing is excessive. Pay close attention to asset quality by checking for goodwill impairments or inventory write-downs, as these may indicate overvalued assets on the books.
Cash flow statement analysis becomes more powerful when you compare operating cash flow to reported net income. Persistent gaps between these figures may reveal earnings quality problems. We also recommend examining free cash flow trends and whether capital expenditures align with depreciation rates.
Develop a watchful eye for these common red flags when understanding financial statements:
- Declining revenue alongside stable or increasing costs
- Deteriorating profit margins over consecutive quarters
- Growing gap between reported earnings and actual cash flow
- Increasing days sales outstanding (DSO) or inventory days
- Rising debt levels without corresponding growth
- Frequent “one-time” charges appearing regularly
- Qualified audit opinions or unexplained accounting method changes
Consider this real-world warning sign: when a company’s “sales tumbled by 7.3% annually over the last five years” while expenses remain unchanged, it signals serious operational issues. Similar to the “depletion of cash reserves” which might indicate an upcoming fundraising event that could trigger shareholder dilution.
We strongly recommend developing a systematic approach to financial statement analysis. Create a personal checklist or template to ensure you evaluate the same factors consistently across different companies and time periods. This disciplined method helps prevent emotional decision-making based on incomplete information.
Valuable resources for deepening your skills include the SEC’s EDGAR database for comparing statements across companies, financial analysis textbooks by Krishna Palepu and Paul Healy, and specialized online courses from reputable financial education platforms.
Remember that effective financial statement analysis is both an art and a science. The numbers tell a story, but you need to develop the skill to read between the lines. With practice and these practical techniques, you’ll move beyond basic understanding financial statements to gaining deeper insights into a company’s true financial condition.
Applying Your Knowledge: Making Informed Decisions
The transition from merely perusing stock quotes to comprehensively analyzing financial statements elevates your status from a casual observer to a discerning investor. This transformation empowers you to act on your newfound understanding.
In the evaluation of investment prospects, financial statements serve as the cornerstone of your decision-making process. Seek out entities with a track record of revenue expansion, sustained profit margins, and robust cash flow generation. FedEx exemplifies the efficacy of thorough financial analysis, unveiling operational prowess and market dominance.
Financial statement analysis necessitates a nuanced understanding of both numerical data and contextual implications. An increase in debt, for instance, may not be detrimental if it finances lucrative growth initiatives. Equally, a decline in quarterly profits could be a temporary phenomenon, resulting from strategic investments.
Develop a personalized investment checklist grounded in fundamental financial statement analysis:
• Is revenue consistently increasing?
• Do profit margins exhibit stability or growth?
• Is the company generating positive cash flow?
• Is debt at a manageable level?
• How effectively does management allocate capital?
Compare these metrics against industry standards to discern leaders in the field. Financial statements, while reflective of past performance, offer invaluable insights into a company’s future prospects.
Financial statement analysis is an art and a science, requiring practice to master. The more you engage in this analysis, the more adept you will become at identifying opportunities and avoiding risks. Through consistent application of these analytical techniques, you will enhance your investment decision-making, aligning with your financial objectives.